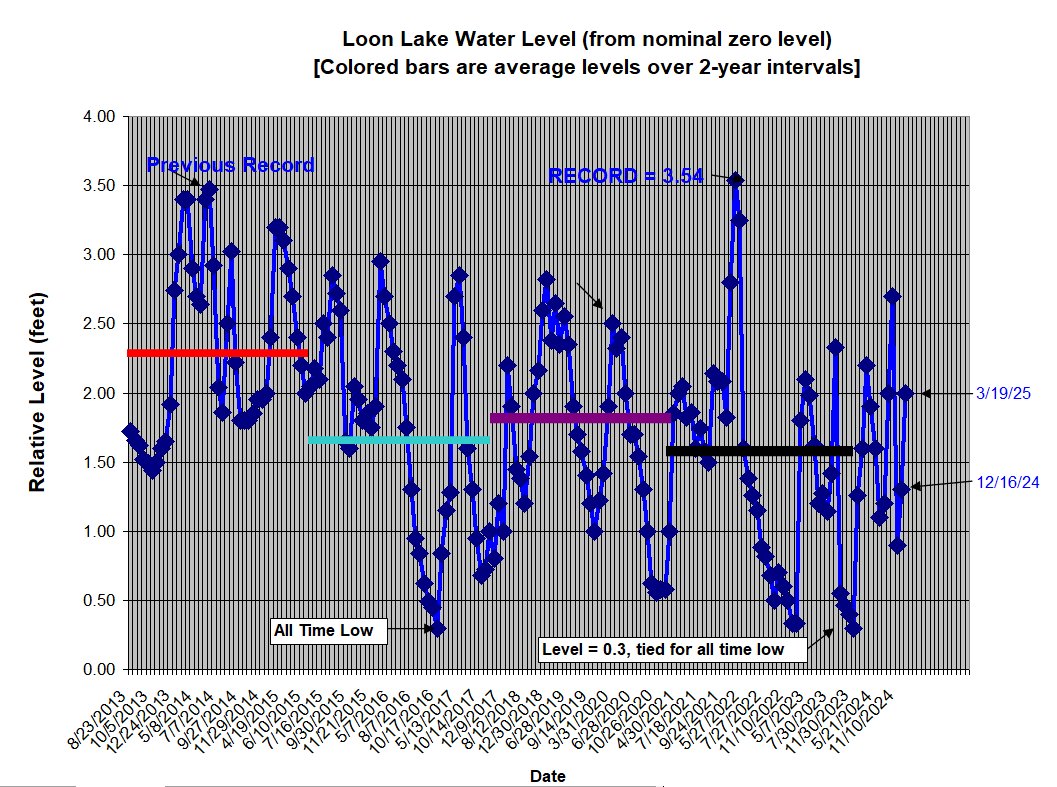
The lake depends on snow and rain (and some springs) to keep the water level up. The red line is the lake level average from 8/13 to 8/15 in feet from an arbitrary starting point of 0 feet. The cyan line is the lake level average from 8/15 to 8/18. The magenta line is the average lake level from the 8/18 to 8/20. The black line is the average lake level from 9/19 to 9/21. On 11/9/20 the level was at 0.58 feet. The minimum recorded level over the period from 8/23/13 (when we started measuring) until now was 0.3 feet. The maximum level recorded was 3.54 feet on on 10/31/21 (see arrow) – which is a new high since we have been keeping track beginning 8/23/13! We went from that record high to tying the low record of 0.3 feet. As of 10/23/2023 the level is at 0.4 feet – approaching the all-time low. (One caveate: we changed the measuring location from John’s dock to the notch on his permanent deck, so measurements could be slightly off).
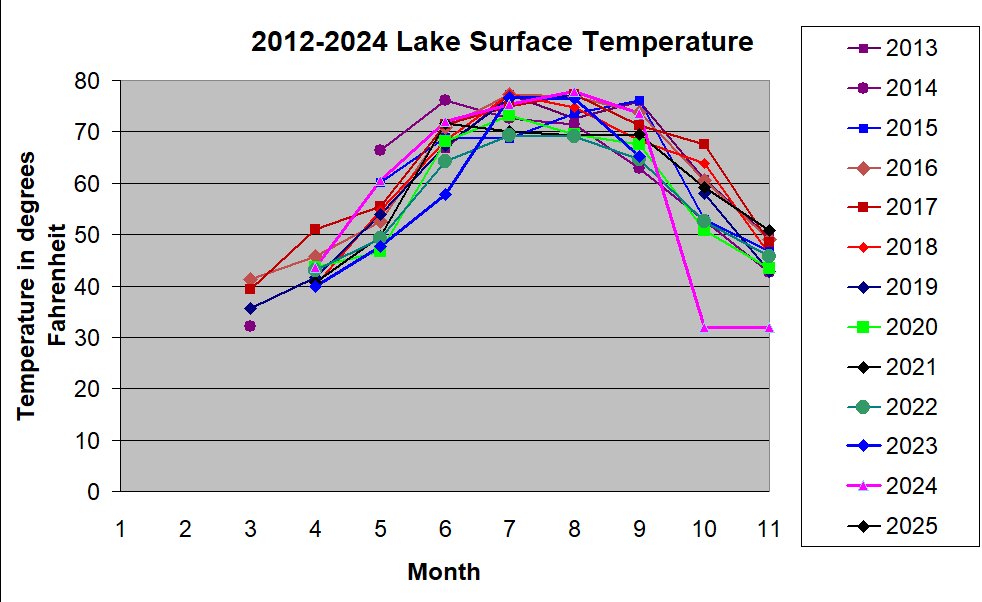
Note that I have added a graph of the lake temperature at the surface over the years 2012-2024 by month.
[Thanks to John Hayden for measuring the level every 2 weeks.]

